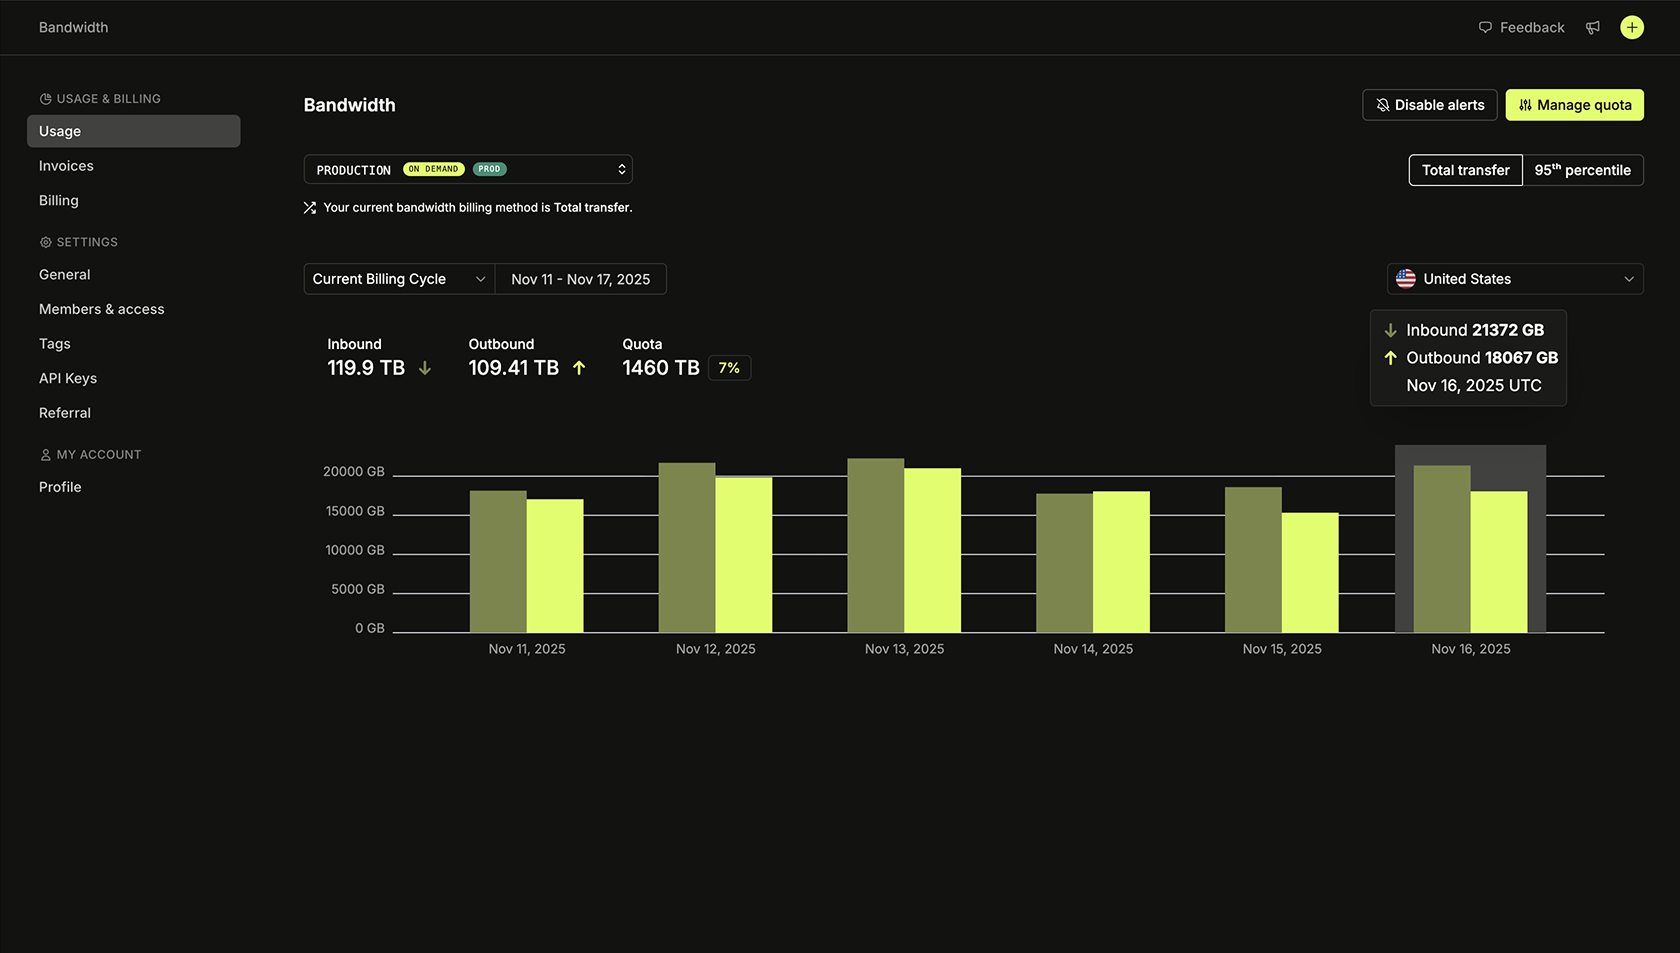
- Total transfer: Shows the total data transferred (both inbound and outbound).
- 95th percentile: Calculates billing based on the 95th percentile of usage, ignoring the top 5% of usage peaks to provide predictable costs.
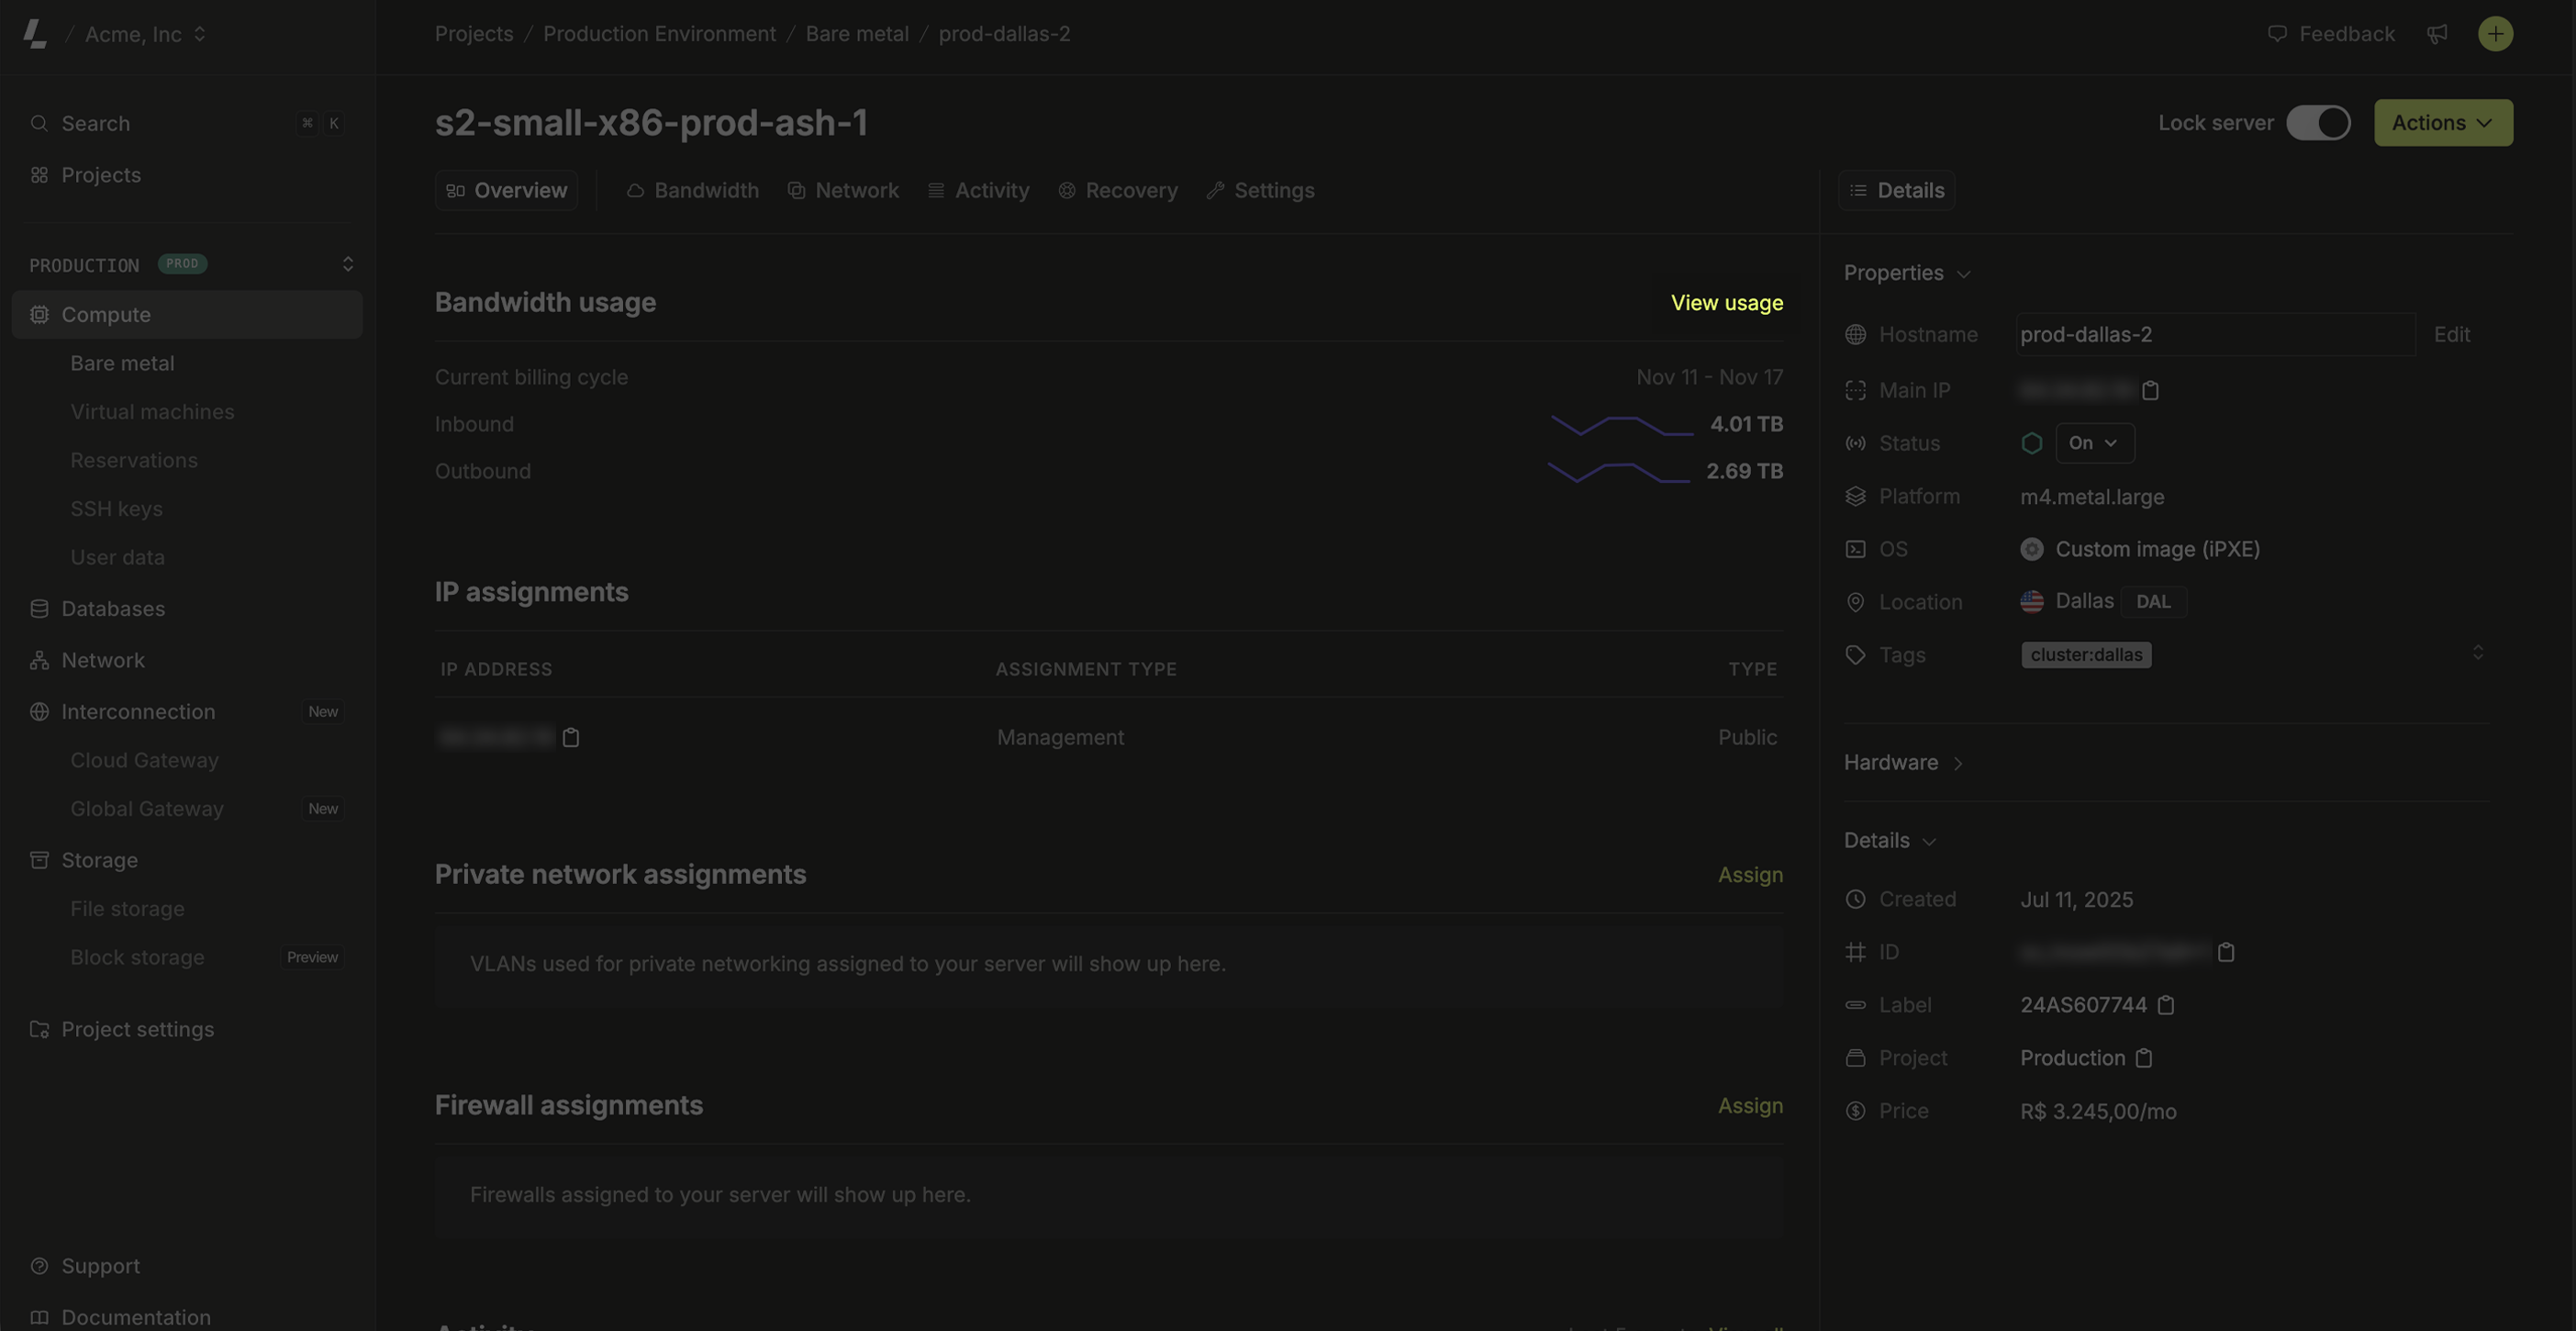
- Inbound and outbound traffic: Displays the amount of ingress and egress data used in the selected region.
- Usage chart: The usage chart provides a visual breakdown of bandwidth over time within the current billing cycle. Each bar represents the amount of data transferred on specific days, helping you identify peak usage periods.
- Quota: This is the total public data transfer your project can use before incurring overage charges. Each Latitude.sh server includes 20 TB of free egress traffic and unlimited inbound ingress traffic. The 20 TB per server is added to your project’s quota, which is shared among all servers in the same project and country.
| Type | Amount added to quota |
|---|---|
| Free bandwidth | 20 TB per server |
| Additional bandwidth | Sold in increments of 10 TB. See pricing |
Bandwidth is pooled even if servers are in different cities in the same
country. E.g., if you have servers in the US located in different cities, they
will share the same Bandwidth Quota.
Managing your quota
You can increase and decrease your quota by going to the Usage & Billing → Overview → View details, and clicking Manage quota in the top right. Additional bandwidth is sold in increments of 10 TB and automatically increases your quota for the selected country.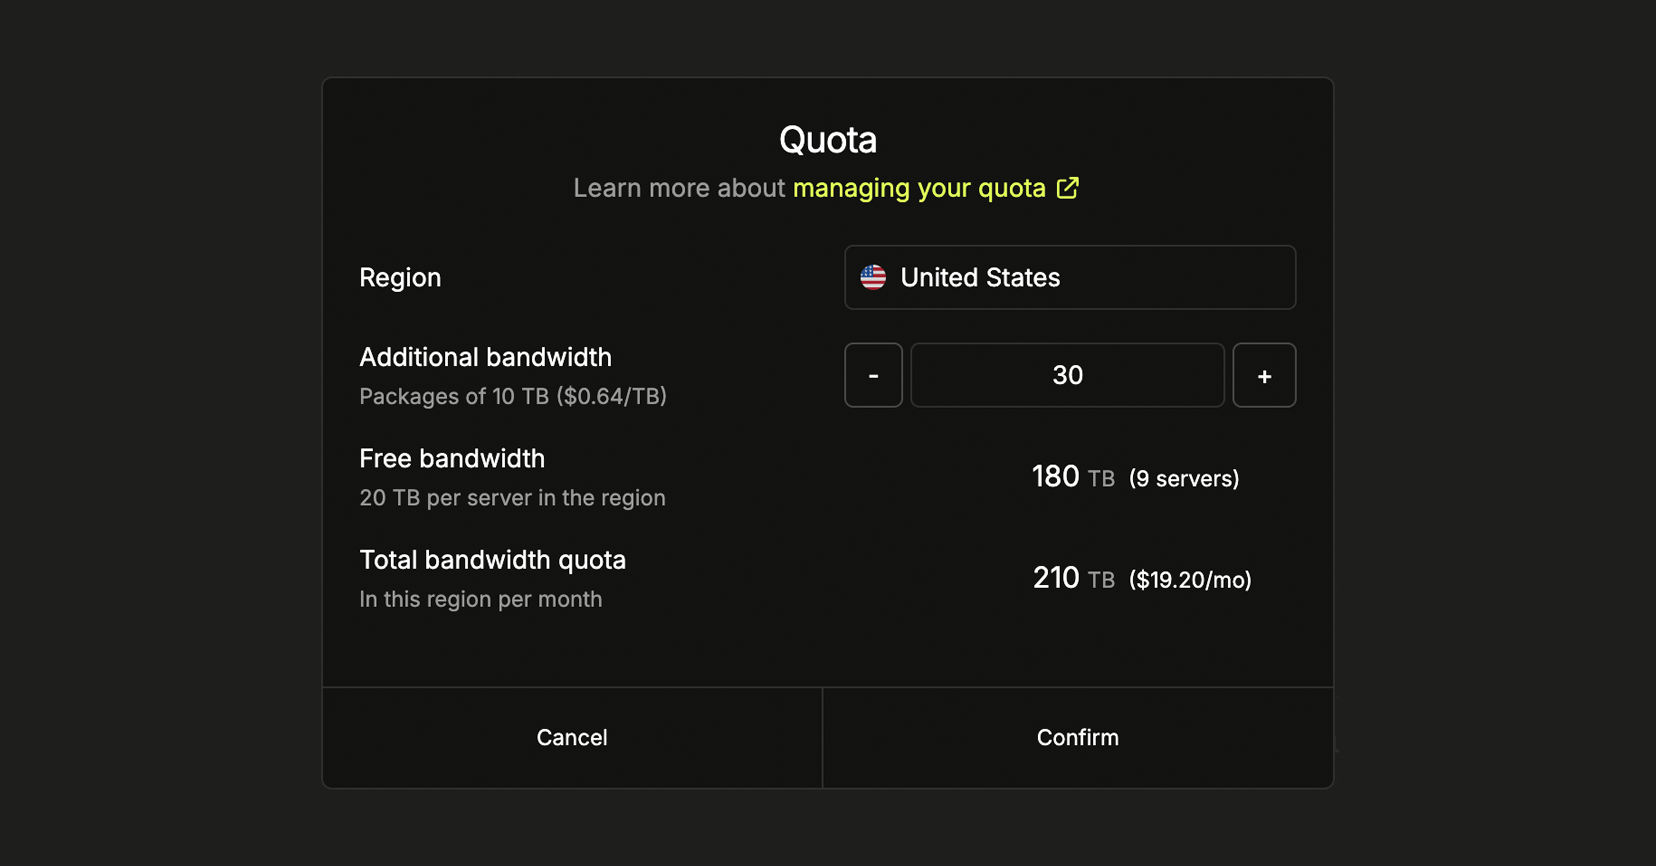
Bandwidth alerts
Bandwidth alerts notify users with the Administrator role when the bandwidth quota for a region exceeds 80%. This feature helps you monitor and manage usage more effectively. Follow these steps to enable Bandwidth alerts:- Navigate to Settings > Project > General in your Project Settings.
- Under Bandwidth alerts, click Enable.