Prerequisites
- A running Kubernetes cluster.
kubectlconfigured.Helm 3installed on your local machine.
Step 1: Add the Prometheus Helm repository
Step 2: Install the Prometheus stack
Install everything (Prometheus, Grafana, Alertmanager) with one command:Step 3: Verify installation
1
Check pods status
Check if all pods are running:You should see the pods of the monitoring stack running:
2
Check services
Check the services:This will show the created services for the monitoring stack and their assigned IPs.
Step 4: Access the Grafana dashboard
By default, Grafana is only accessible from within the cluster. Use port forwarding to view it locally.1
Set up port forwarding
Run the following command to forward the port:
2
Open Grafana
Open http://localhost:3000 in your browser.
3
Login with default credentials
Log in with the default credentials: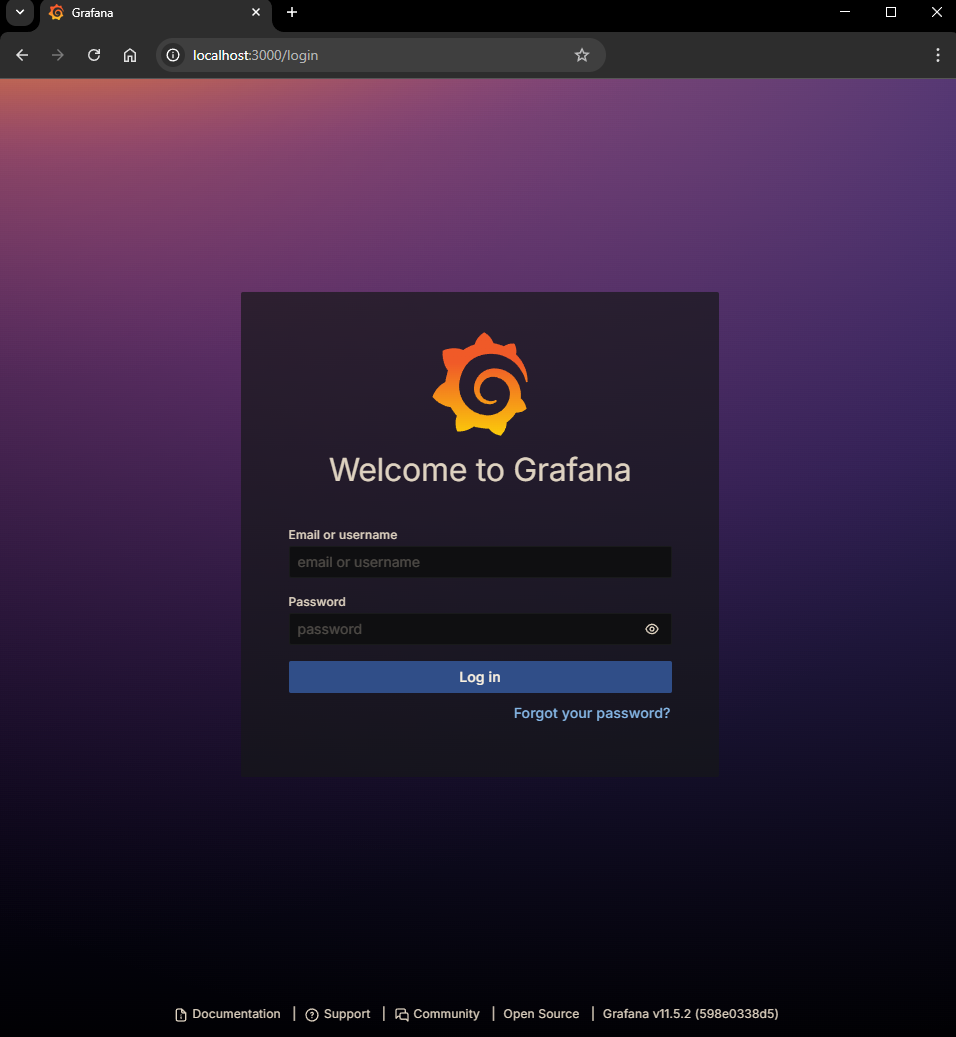
- Username: admin
- Password: prom-operator
Step 5: Confirm Prometheus as a data source
Thekube-prometheus-stack automatically sets up Prometheus as a data source in Grafana. To check:
1
Login to Grafana
Login to Grafana.
2
Go to Data Sources
Go to Connections > Data Sources.
3
Confirm Prometheus
Confirm Prometheus is listed.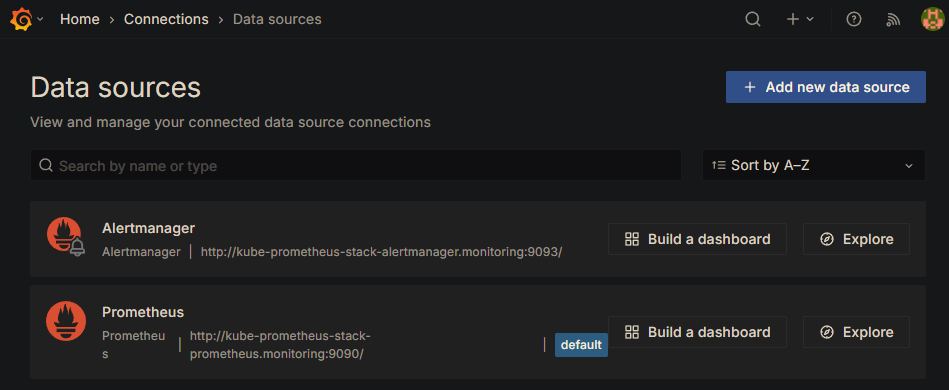
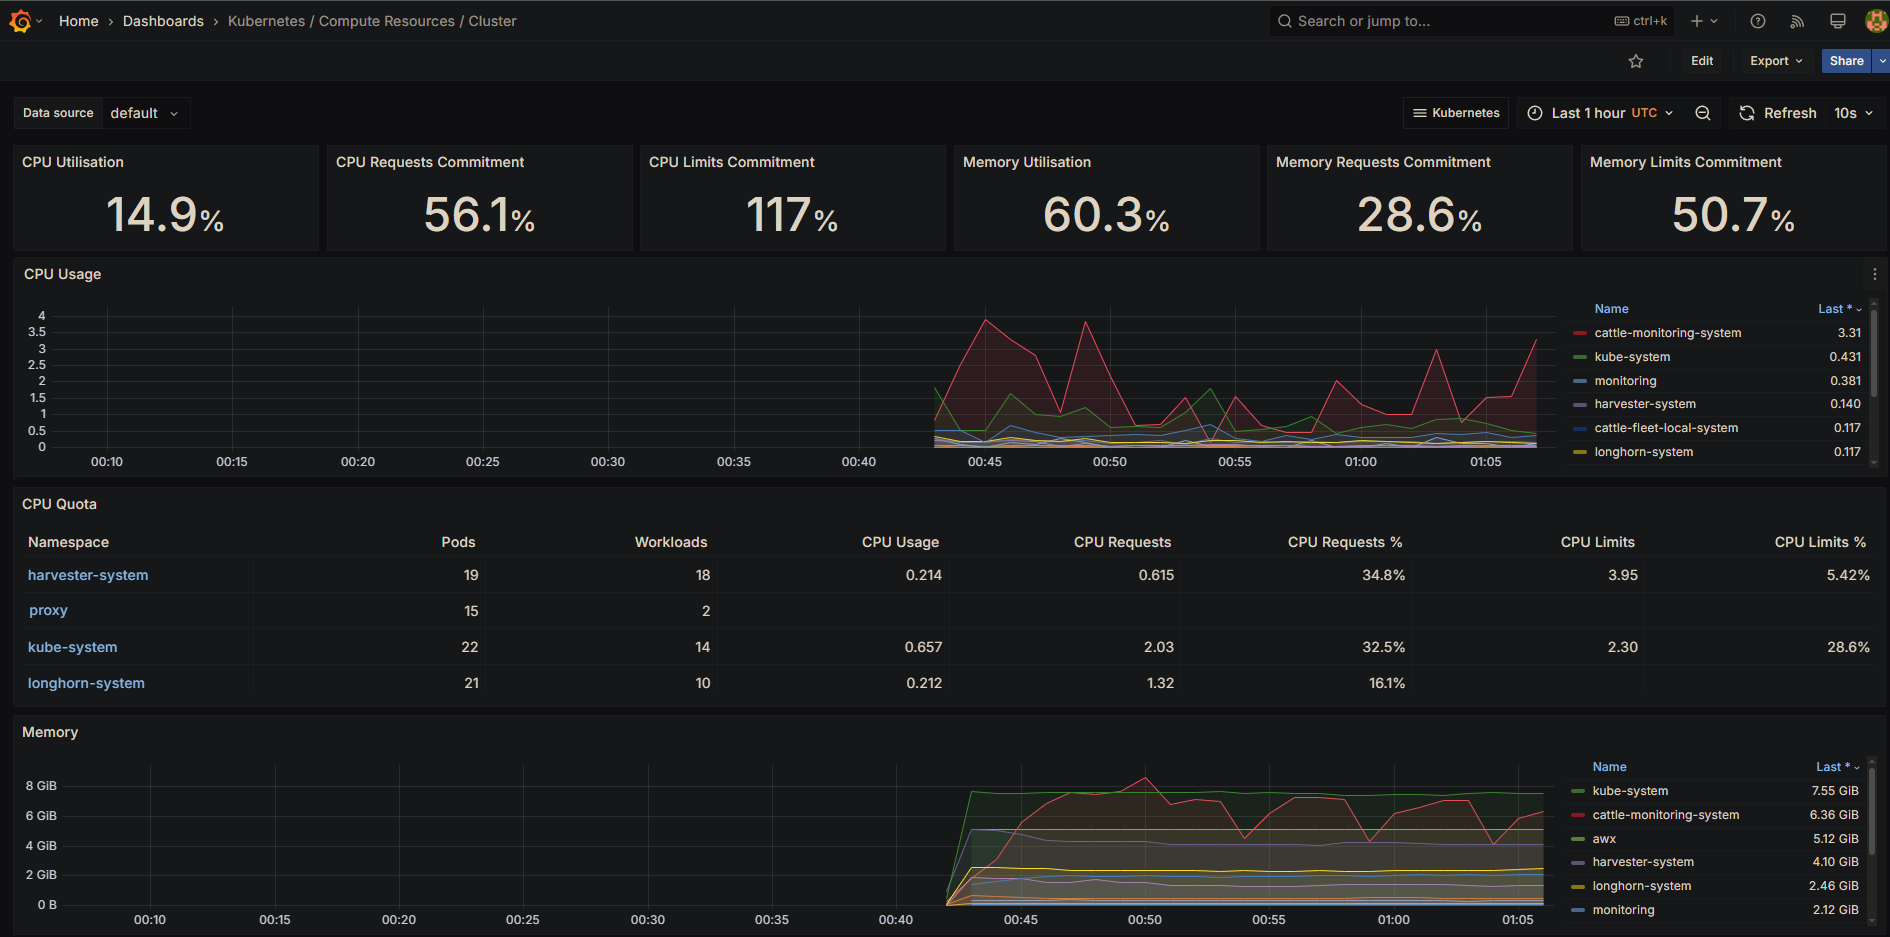
Step 6: Explore dashboards
Grafana includes several pre-built dashboards out of the box. To access them:1
Navigate to dashboards
Click Dashboards in the sidebar.
2
Browse available dashboards
Select Browse.
- Overall cluster CPU, memory, and filesystem usage.
- Pod and container performance.
- System service metrics.
Step 7: Set up basic alerts
Alertmanager is already included as part of the kube-prometheus-stack. To manage alerts:
1
View alerts
In Grafana, go to Alerting > Alert Rules.
View existing alerts or create new ones.
2
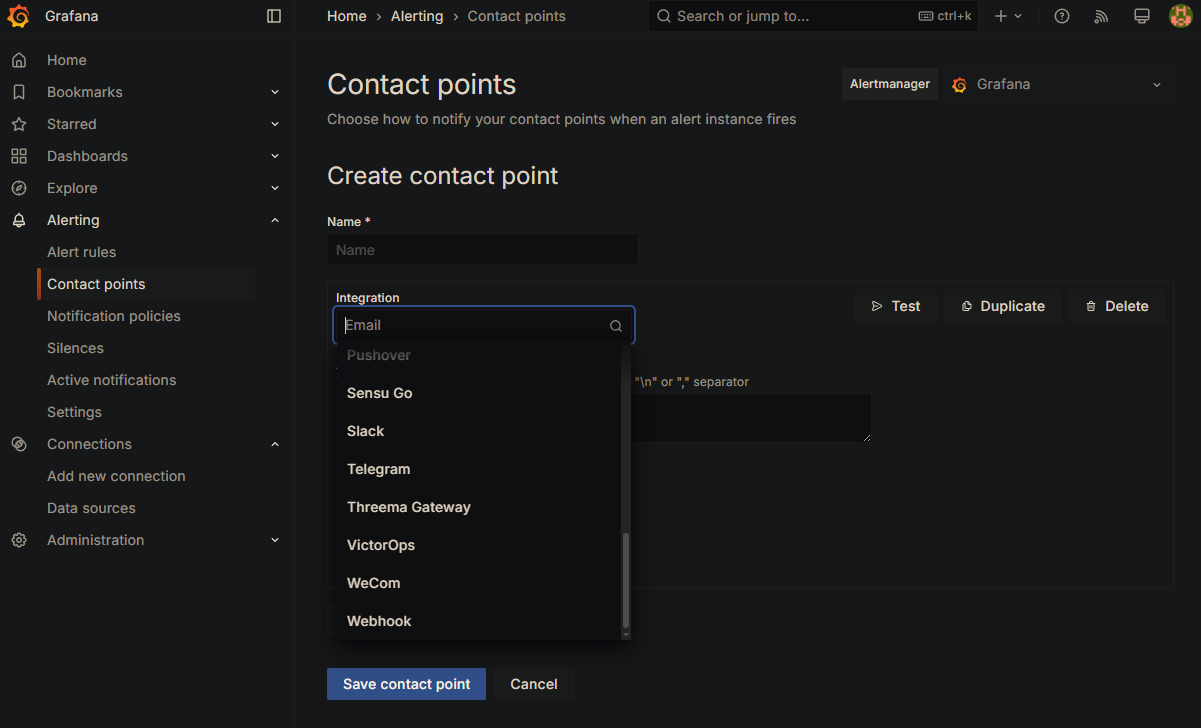
Configure contact points
To receive alerts:Go to Alerting > Contact points.
Click Create contact point.
Set up notifications (email, Slack, etc.).