> ## Documentation Index
> Fetch the complete documentation index at: https://www.latitude.sh/docs/llms.txt
> Use this file to discover all available pages before exploring further.
# Monitoring a Kubernetes cluster on bare metal with Prometheus and Grafana
> Get real-time visibility into your cluster's health and performance
After [deploying your Kubernetes cluster on bare metal](/guides/kubernetes-on-bare-metal), it's important to set up monitoring to track its health and performance.
This guide walks you through installing and configuring [Prometheus](https://prometheus.io/) and [Grafana](https://grafana.com/) to collect metrics, visualize data, and set up alerts for your Kubernetes environment. Let's get started!
## Prerequisites
* A running Kubernetes cluster.
* `kubectl` configured.
* `Helm 3` installed on your local machine.
Verify your cluster is ready:
```shell theme={null}
kubectl cluster-info
```
## Step 1: Add the Prometheus Helm repository
```bash theme={null}
helm repo add prometheus-community https://prometheus-community.github.io/helm-charts
helm repo update
```
## Step 2: Install the Prometheus stack
Install everything (Prometheus, Grafana, Alertmanager) with one command:
```bash theme={null}
helm install monitoring prometheus-community/kube-prometheus-stack
```
This uses default settings and creates a full monitoring stack.
## Step 3: Verify installation
Check if all pods are running:
```bash theme={null}
kubectl get pods
```
You should see the pods of the monitoring stack running:
```bash theme={null}
> kubectl get pods -n monitoring
NAME READY STATUS RESTARTS AGE
alertmanager-kube-prometheus-stack-alertmanager-0 2/2 Running 0 53s
kube-prometheus-stack-grafana-76649cf75d-r4x7k 3/3 Running 0 3m6s
kube-prometheus-stack-kube-state-metrics-77899fc47f-xmkhf 1/1 Running 0 3m6s
kube-prometheus-stack-operator-6b6c6f966d-hrsjk 1/1 Running 0 3m6s
kube-prometheus-stack-prometheus-node-exporter-dcwzq 1/1 Running 0 3m6s
prometheus-kube-prometheus-stack-prometheus-0 2/2 Running 0 3m6s
```
Check the services:
```bash theme={null}
kubectl get services -n monitoring
```
This will show the created services for the monitoring stack and their assigned IPs.
## Step 4: Access the Grafana dashboard
By default, Grafana is only accessible from within the cluster. Use port forwarding to view it locally.
Run the following command to forward the port:
```bash theme={null}
kubectl port-forward svc/kube-prometheus-stack-grafana -n monitoring 3000:80
```
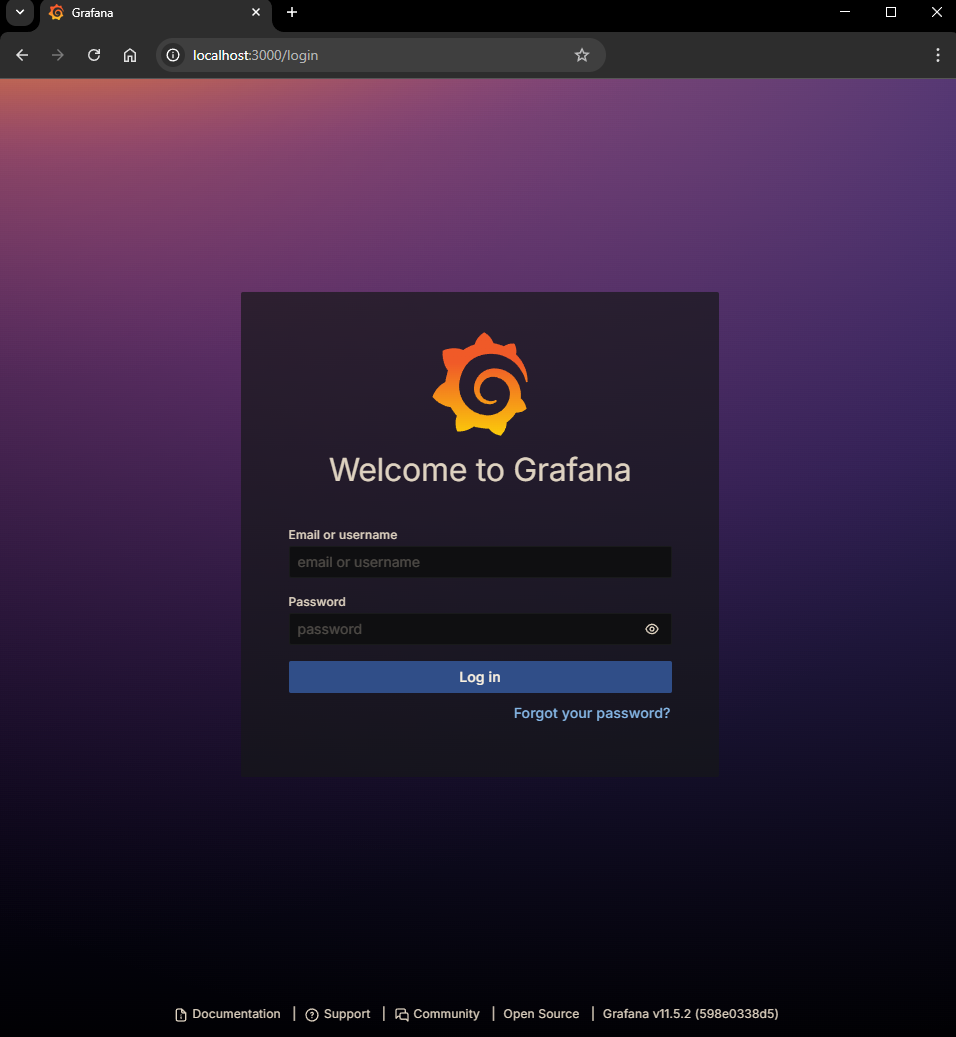
Open [http://localhost:3000](http://localhost:3000/) in your browser.
Log in with the default credentials:
* **Username:** admin
* **Password:** prom-operator
 If you need to retrieve the password:
```bash theme={null}
kubectl get secret kube-prometheus-stack-grafana -n monitoring -o jsonpath="{.data.admin-password}" | base64 --decode; echo
```
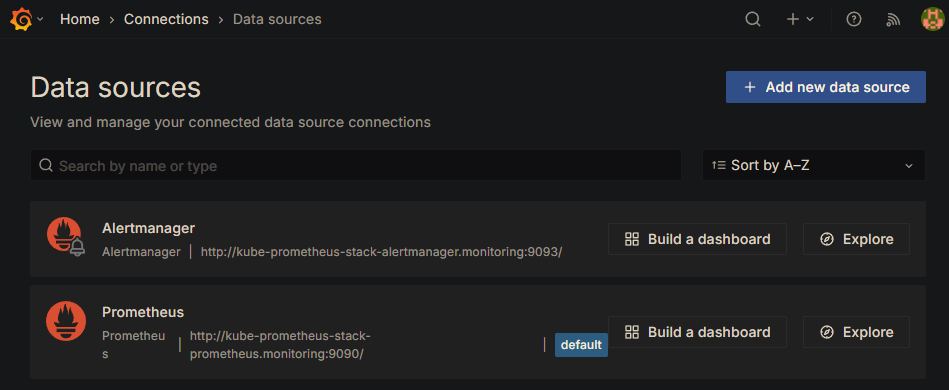
## Step 5: Confirm Prometheus as a data source
The `kube-prometheus-stack` automatically sets up Prometheus as a data source in Grafana. To check:
Login to Grafana.
Go to **Connections > Data Sources**.
Confirm Prometheus is listed.
If you need to retrieve the password:
```bash theme={null}
kubectl get secret kube-prometheus-stack-grafana -n monitoring -o jsonpath="{.data.admin-password}" | base64 --decode; echo
```
## Step 5: Confirm Prometheus as a data source
The `kube-prometheus-stack` automatically sets up Prometheus as a data source in Grafana. To check:
Login to Grafana.
Go to **Connections > Data Sources**.
Confirm Prometheus is listed.
 ## Step 6: Explore dashboards
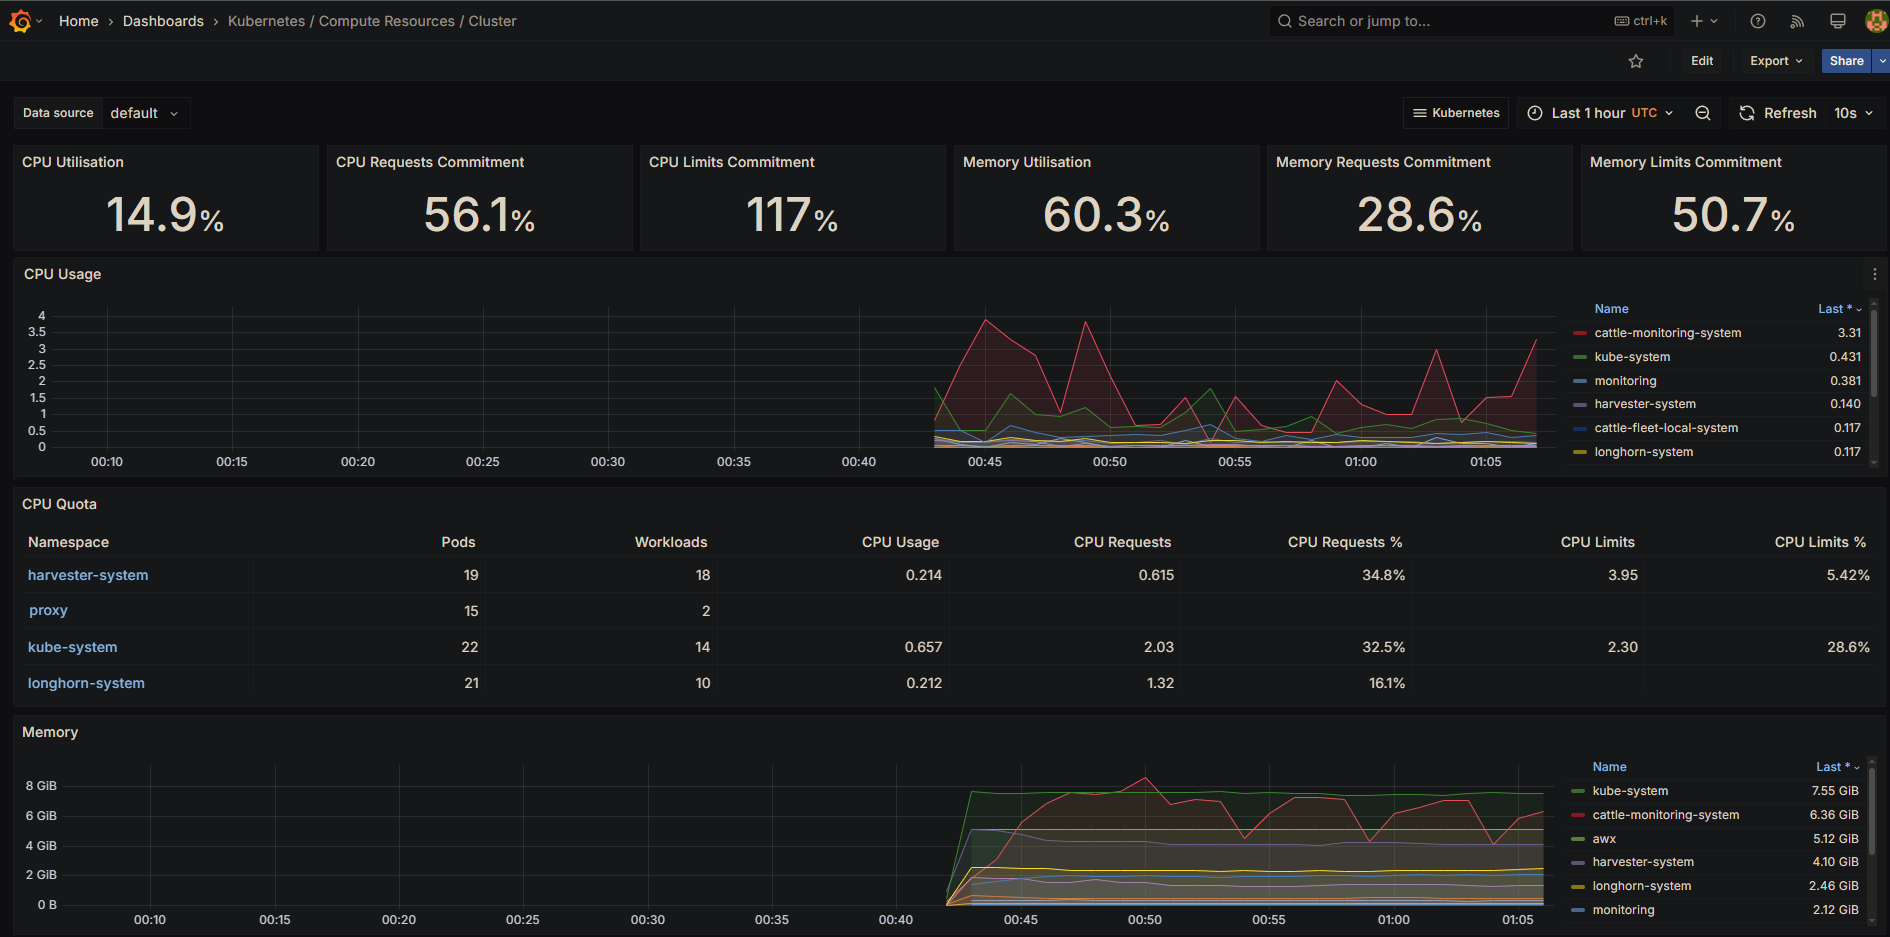
Grafana includes several pre-built dashboards out of the box. To access them:
Click **Dashboards** in the sidebar.
Select **Browse**.
For a high-level overview, start with **Kubernetes / Compute Resources / Cluster**. This dashboard provides insights into:
* Overall cluster CPU, memory, and filesystem usage.
* Pod and container performance.
* System service metrics.
## Step 6: Explore dashboards
Grafana includes several pre-built dashboards out of the box. To access them:
Click **Dashboards** in the sidebar.
Select **Browse**.
For a high-level overview, start with **Kubernetes / Compute Resources / Cluster**. This dashboard provides insights into:
* Overall cluster CPU, memory, and filesystem usage.
* Pod and container performance.
* System service metrics.
 ## Step 7: Set up basic alerts
`Alertmanager` is already included as part of the `kube-prometheus-stack`. To manage alerts:
In Grafana, go to **Alerting > Alert Rules**.
View existing alerts or create new ones.
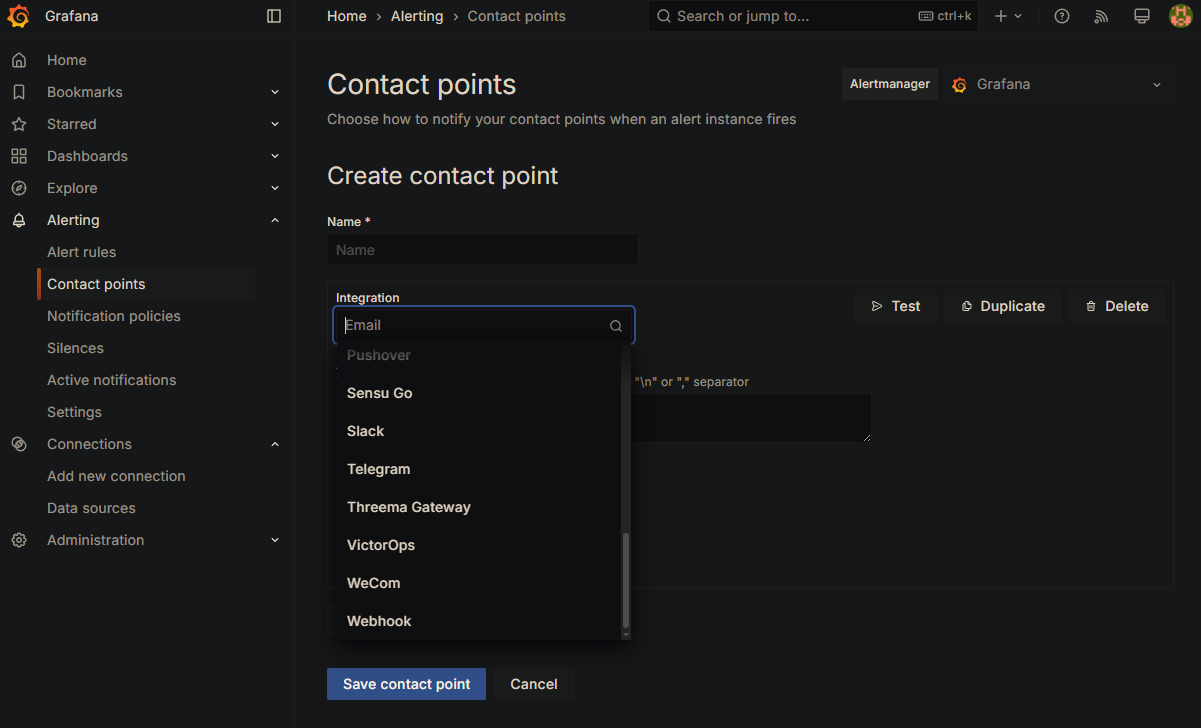
To receive alerts:
Go to **Alerting > Contact points**.
Click **Create contact point**.
Set up notifications (email, Slack, etc.).
## Step 7: Set up basic alerts
`Alertmanager` is already included as part of the `kube-prometheus-stack`. To manage alerts:
In Grafana, go to **Alerting > Alert Rules**.
View existing alerts or create new ones.
To receive alerts:
Go to **Alerting > Contact points**.
Click **Create contact point**.
Set up notifications (email, Slack, etc.).
 ## Done!
You now have a working monitoring setup for your Kubernetes cluster. For advanced dashboards or deeper integration, check out the [Prometheus](https://prometheus.io/docs/) and [Grafana](https://grafana.com/docs/) documentation.
## Done!
You now have a working monitoring setup for your Kubernetes cluster. For advanced dashboards or deeper integration, check out the [Prometheus](https://prometheus.io/docs/) and [Grafana](https://grafana.com/docs/) documentation.